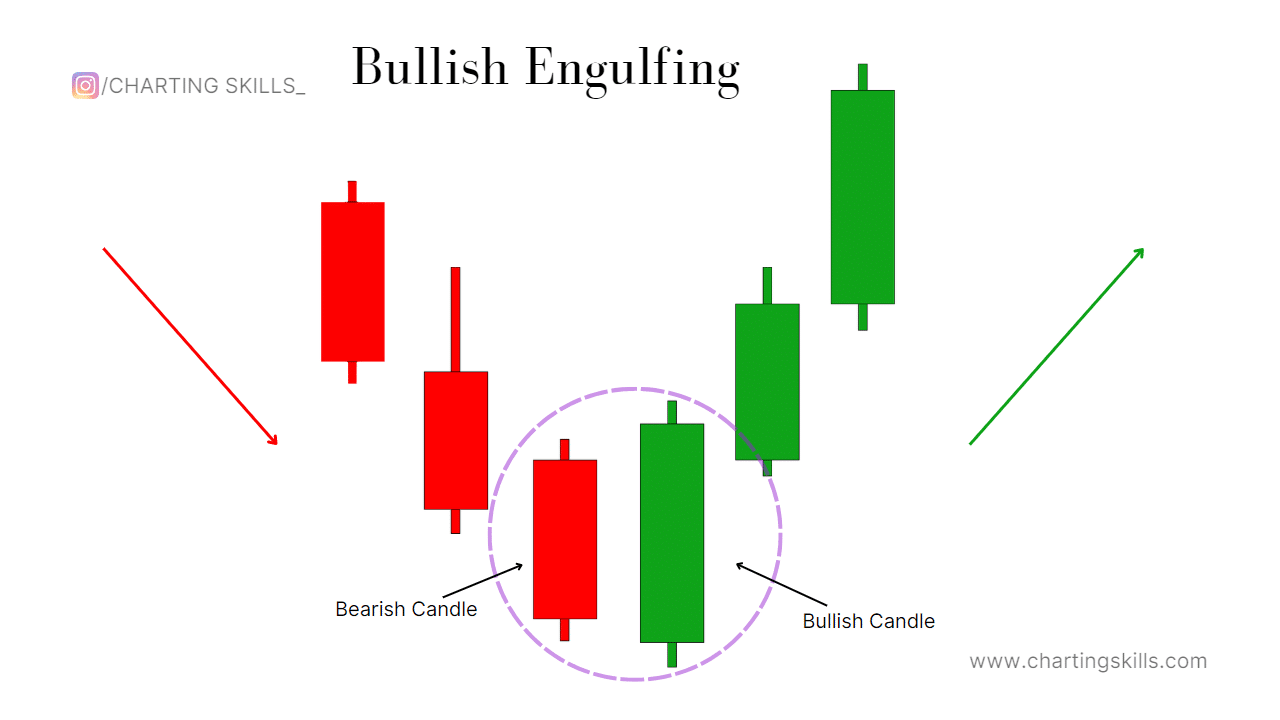
The bullish engulfing candlestick pattern is one of the most powerful bullish candlestick patterns.
It consists of two candles one is a bearish candle showing a downtrend in the market, and another is a bullish candle showing that buyers are taking control of the price.
‘Engulfing’ means covering the bearish candle completely. That is why in a Bullish engulfing pattern we can see one candlestick covers (or engulfs) another.
In this post, we are going to explain what is a bullish engulfing pattern, how it forms, and how to trade it with some examples. So without further ado let’s begin.
What is a Bullish Engulfing Pattern?
A Bullish Engulfing pattern is a technical analysis pattern that signals a potential reversal from a downtrend to an uptrend.
It consists of two candlesticks: a small bearish (red or black) candlestick and a larger bullish (green or white) candlestick that engulfs or covers the entire body of the previous candlestick.

This pattern indicates that buying pressure has overcome selling pressure and suggests that the market trend is changing from a downtrend (bearish) to an uptrend (bullish).
How does the Bullish Engulfing pattern form?
Understanding the formation of the bullish engulfing pattern on the price chart is crucial.
It can assist us in executing trades at the optimal time and position on the charts.
The following five points illustrate how to identify bullish engulfing candlestick patterns.

- The price should be in a downtrend or at the support level.
- A small bearish candle forms, representing a continuation of the selling pressure.
- The next candle opens lower than the previous day’s close, creating a gap.
- Buyers then enter the market and try pushing prices higher.
- The bullish candle closes above the previous candle’s open/high, engulfing the entire body of the bearish candle.
How to trade a Bullish Engulfing pattern?
The Bullish Engulfing candlestick pattern can boost your trading success. With an impressive success rate of 70% to 80%, this pattern has captured the attention of traders worldwide.
Trading the Bullish Engulfing pattern requires a systematic approach to maximize its potential.
Following these guidelines can enhance your trading decisions, and you can take advantage of this high-probability setup.
Identify a Downtrend or Major Support Level:
The Bullish Engulfing pattern is most effective when the market is a downtrend or when the price reaches a significant support level. This context increases the likelihood of a trend reversal.
Entry on the Bullish Engulfing Candlestick:
Take your entry once the Bullish Engulfing pattern forms. This candlestick consists of a smaller bearish candle followed by a larger bullish candle that engulfs the entire body of the previous candle.
Entry Timing:
To increase your chances of catching the reversal, consider entering the trade within 20 seconds of the Bullish Engulfing candlestick formation. This helps you capitalize on the immediate momentum shift.
Stop Loss:
Place your stop loss a few points below the low of the Bullish Engulfing candlestick. This helps limit your risk and protects your capital if the pattern fails.
Target:
Set your initial target at approximately 50% of the preceding downtrend. For example, if 1000₹ stock falls ₹20, then target a ₹10 gain.
However, when trading Bank Nifty, adjust the target slightly below 50%.
For instance, if Bank Nifty falls 300 points, aim for a first target of 100 points, a second target of 150 points, and a third target of 200 points.
Additional Criteria for Bank Nifty and Stocks:
In Bank Nifty, There should be a minimum of seven bearish candles and a 150-point fall before considering a Bullish Engulfing pattern.
For stocks, seek at least nine bearish candles and a 1.5% price fall. There can be 1 or 2 green candles between these candles, which is not a problem.
However, on the daily timeframe, ensure there are no green candles between the bearish candles, and there should be 4 continued bearish candles, as this strengthens the validity of the pattern.
Examples of Bullish Engulfing Patterns
Example Number 1: Reliance INDS chart on a Daily time frame.

Example Number 2: Bank Nifty chart in 5 min time frame.

Example Number 3: ICICI Bank chart on 1-day time frame.

Example Number 4: Trent LTD chart on 15 min time frame.

Note: All chart patterns are taken from tradingview.com
Key Points to Remember While Trading Bullish Engulfing Pattern
Risk Management: Like any trading strategy, implementing proper risk management is crucial when trading the Bullish Engulfing pattern.
Set a stop loss below the low of the Bullish Engulfing candlestick or at a predetermined level based on your risk tolerance to protect your capital.
Confirmation: It’s important to seek additional confirmation when trading this pattern. Look for supporting factors such as trendline support, horizontal levels, EMA (Exponential Moving Average), or other technical indicators that validate the potential trend reversal indicated by the Bullish Engulfing pattern.
False Signals: Remember that the Bullish Engulfing pattern can sometimes produce false signals.
Therefore, it is necessary to consider the overall market direction, sentiment, and other relevant factors before entering a trade based solely on this pattern.
Consider the Context: The success rate of the Bullish Engulfing pattern is higher when it appears after a significant downtrend or near key support levels.
Additionally, it may work better when aligned with other technical tools like Fibonacci retracement levels or EMA indicators.
By remembering these key points, you can enhance your trading decisions and increase the effectiveness of the Bullish Engulfing pattern as a tool in your trading strategy.
Conclusion
Throughout this blog post, we have explored the Bullish Engulfing pattern in depth. We started by defining the pattern and understanding its formation process, allowing you to identify it on price charts quickly.
We then discussed effectively trading the pattern, considering market context, entry timing, stop loss placement, and target setting.
These guidelines, combined with the impressive success rate of 70% to 80%, make the Bullish Engulfing pattern a compelling choice for traders worldwide.
However, it’s important to remember that successful trading goes beyond the pattern. Risk management is critical in protecting your capital, and seeking additional confirmation from supporting factors can strengthen your trading decisions.
Moreover, always consider the overall market direction, sentiment, and other relevant factors to filter out potential false signals and increase your trading success.