After having basic knowledge of all candlestick patterns, we will explore bearish candlestick patterns in depth.
These candlestick patterns indicate the uptrend reversal on the price chart.
As you may know, There are multiple patterns, but I use these six powerful bearish candlestick patterns in trading to avoid confusion.
Before Using these bearish candlestick patterns, keep these things in mind:
- These bearish reversal candlestick patterns will only work at the end of an uptrend.
- One should use multiple confirmations before using a bearish reversal candlestick.
Now, Let’s check out these bearish reversal patterns one by one.
6 Powerful Bearish Candlestick Patterns

Bearish Engulfing Candlestick Pattern
Bearish Engulfing Candlestick is a bearish reversal candlestick pattern made with two candlesticks, which indicates an uptrend reversal.
It forms when a bearish candle completely engulfs a bullish candle in an uptrend. More clearly speaking, in this pattern, a red candle (bearish candle) completely covers the green candle (bullish candle).
Bearish engulfing candles work smoothly in an uptrend. On this candle, traders can exit buying positions or short the stock or security.
Example of a bearish candlestick pattern:
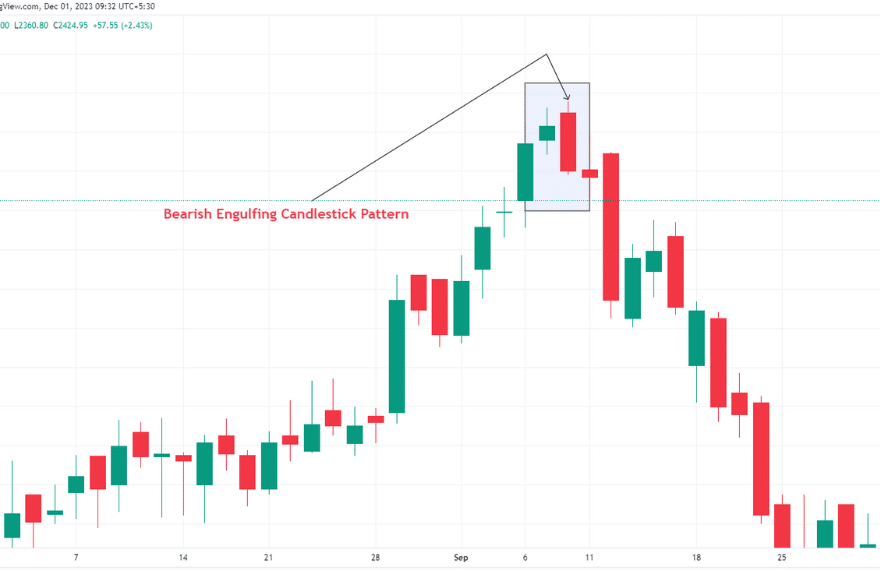
The above example shows how the price starts falling when a bearish engulfing candlestick pattern forms during an uptrend and the trend reverses from up to down.
Hanging Man Candlestick Pattern
Bearish Hammer Candlestick pattern, also known as the hanging man candlestick pattern.
It is the hammer candle, but it forms on the top of an uptrend, so they call it a hanging man candlestick pattern.
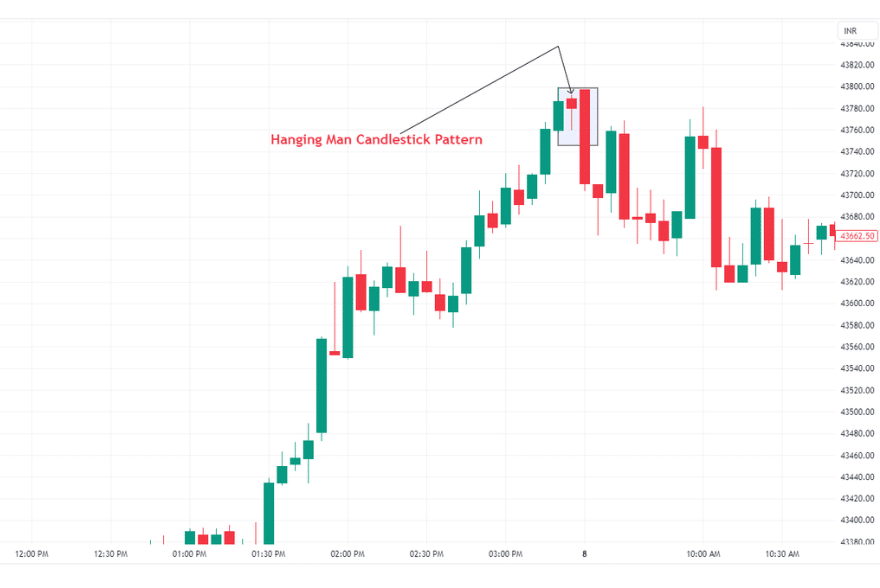
The Hanging Man candlestick pattern is a single candlestick pattern.
It has a small body, and the lower wick size is at least twice the size of the body. This candlestick has no upper wick, or sometimes it has a tiny upper wick, which is okay.
We can trade this pattern when it forms on an ongoing uptrend.
In this pattern, we must take confirmation of successful reversal, and then we should enter.
To take confirmation, we enter when the next candle closes below the low of the hanging man candlestick pattern.
Example of Hanging Man Candlestick Pattern:
Shooting Star Candlestick Pattern
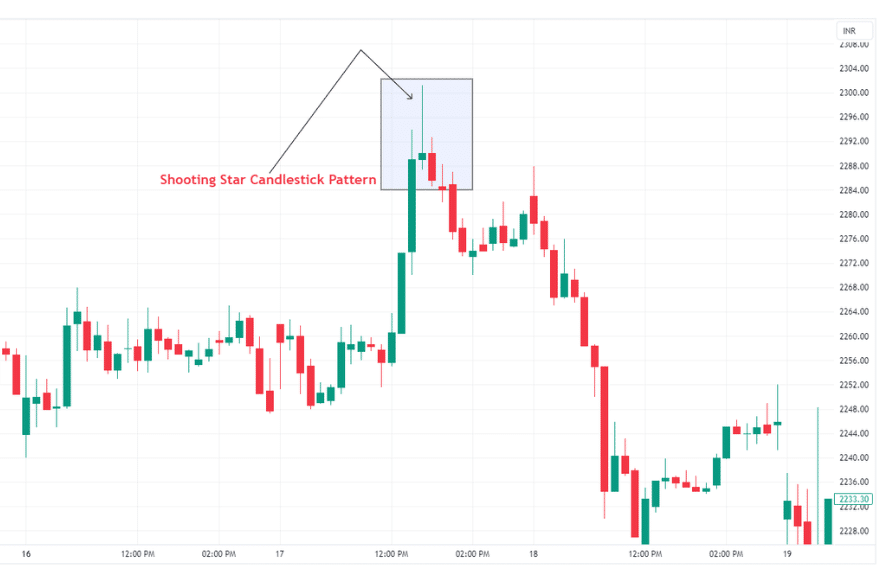
The Shooting Star candlestick is a single candlestick pattern.
It has a small body, and the upper wick size is at least twice the size of the body.
It has no lower wick, or sometimes it has a tiny lower wick, which is okay.
We trade this pattern in an ongoing uptrend as it reverses the uptrend to a downtrend when it forms.
Like the hanging man pattern, we should also take confirmation while trading with the shooting star candlestick pattern.
Example of Shooting Star Candlestick Pattern
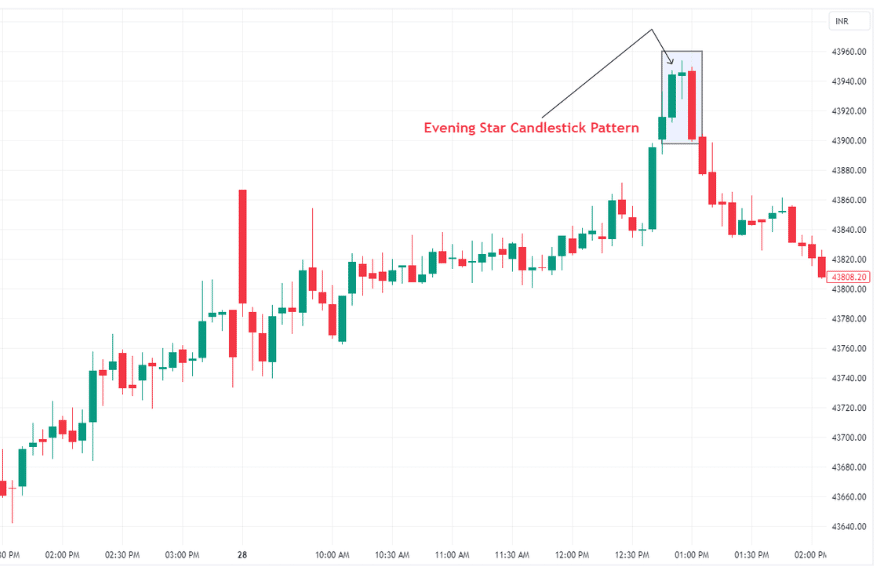
Evening Star Candlestick Pattern
The Evening star pattern is a bearish reversal candlestick pattern.
When the evening star candlestick pattern forms an uptrend, it signals that the trend will change.
The evening star candlestick consists of 3 candles. The first is a bullish candle, the second is doji, and the third is a bearish candle representing the seller’s power.
The psychology behind the evening star pattern is like this: The first candle shows the continuation of an uptrend.
The second candle, the Doji, shows confusion between sellers and buyers, and the third candle shows that sellers are more powerful than buyers.
The evening star pattern works in an uptrend. And it can reverse the ongoing uptrend to a downtrend.
Example of the evening star candle pattern:
Dark Cloud Cover Pattern
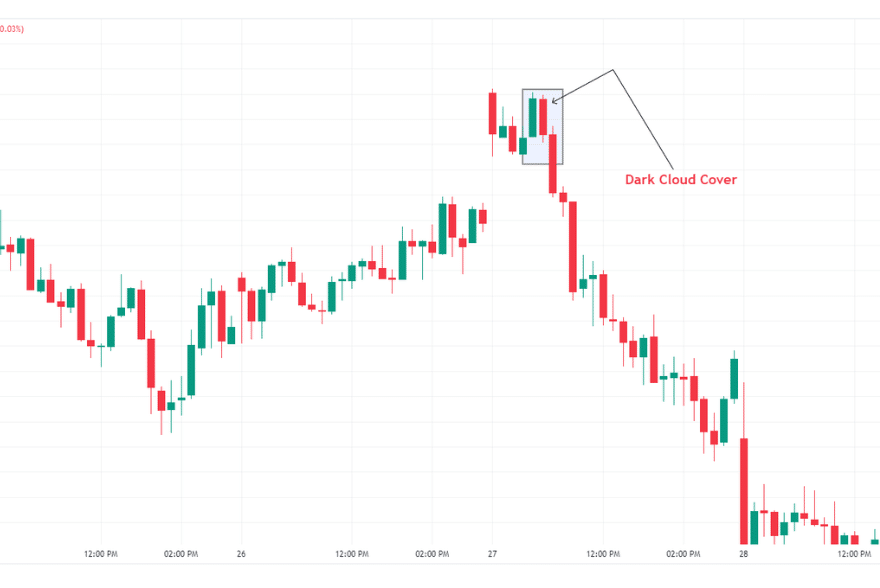
The Dark Cloud Cover is also known as the bearish piercing candlestick pattern.
The Dark Cloud Cover pattern is a bearish reversal candlestick pattern.
The Dark Cloud Cover indicates a reversal in an ongoing uptrend, which means when this pattern appears in a continuous downtrend, the trend will change from up to down.
The Dark Cloud Cover pattern is made of two candles. The first candle is bullish, representing a continuation of the uptrend, and the next candle opens the gap up.
Still, it covers the first bullish candle by more than 50%, which shows that bulls are getting weaker in the uptrend, sellers are back, and the trend is about to change.
When this pattern forms in an uptrend, traders should be cautious about their buying positions or add new selling positions.
Example of the dark cloud cover pattern:
Bearish Marubozu Candlestick Pattern
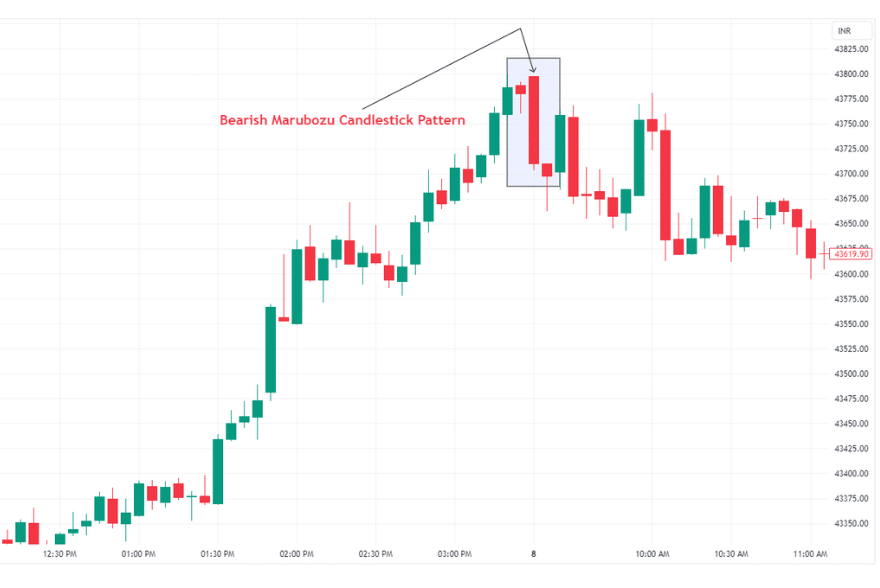
The Bearish Marubozu candle is a bearish reversal candle. It occurs in an uptrend and indicates that the trend will change from up to down.
The Bearish Marubozu candle is a powerful bearish candlestick with no upper or lower wicks.
This candle represents increasing selling pressure in the market, and bulls are getting weaker, so they can’t even be able to keep the price high anymore.
Example of a bearish marubozu candlestick pattern:
Download Printable Bearish Candlestick Patterns PDF
Conclusion
Bearish Engulfing candlestick pattern is a powerful bearish candle form at the top of an uptrend, reversing the trend to a downtrend.
The hanging man is a hammer candle, but it forms at the top of the uptrend, and that’s why we call it hanging man. This candle also works as a reversal pattern.
Then, the Shooting Star is a single candlestick pattern that reverses the trend from up to down, but we must seek confirmation for the shooting star and hanging man candlestick pattern.
An evening star candlestick pattern consists of 3 candles. The first is a bullish candle, the second is doji, and the third is a bearish candle representing the sellers’ power.
A dark cloud is also a bearish reversal candlestick pattern, which reverses the uptrend to the downtrend.
Last but not least, the Bearish Marubozu Candlestick pattern is the powerhouse of candlesticks. If you see this candle, you should enter directly without thinking much but in an uptrend.

