
Finding the best indicator on Tradingview can be difficult, as many indicators are available on the platform. But to make this difficult task easy, I am sharing the Top 10 best tradingview indicators in this post. These 10 indicators include Moving Averages, Volume Profile, RSI, ATR, ADX, VWAP, Super Trend, etc. I will explain how each indicator works. So, Let’s get started without any delay.
1. Moving Average Indicator
The Moving Average indicator is one of the best free indicators on Tradingview and the most popular among traders. This indicator works as dynamic support and resistance on the price chart, and along with this, some traders also use the Moving Average to identify market trends.
There are different moving averages, including simple, exponential, and weighted, each with its own advantages and disadvantages.
- Simple Moving Average: The simple moving average is calculated by taking the average price of a stock or any asset over a specific time, with equal weight given to recent and old prices.
- Exponential Moving Average: The exponential moving average calculates the average price of an asset over a specific time, giving more weight to recent prices and less weight to older prices.
- Weighted Moving Average: The weighted moving average calculates the average of recent and old prices, giving more weight to the recent price.

Overall, the Moving averages indicator is one of the best indicators available on Tradingview for finding dynamic support and resistance. It is an essential tool that can help traders identify potential entry and exit points in the market.
2. Volume Profile Indicator
The Volume Profile Indicator is one of the best indicators on tradingview, showing the supply and demand zone. It helps traders identify support and resistance based on the volume traded at different price levels. It checks the total volume of trades at each price level and creates a profile that shows where the most trading activity happened. This information can be used to make entry and exit decisions.

In simple terms, this tool is excellent for daily traders. It helps them understand support and resistance zones better, showing the levels where most trading happens that regular volume indicators don’t show. That’s why traders often use this indicator to make more profitable trades.
3. Relative Strength Indicator (RSI)
The Relative Strength Indicator (RSI) is a popular momentum oscillator used in technical analysis. It is used to measure the price momentum and price changes. Traders often use the RSI to identify overbought and oversold conditions in the market.
The RSI values range from 0 to 100. In which above 70 indicates the overbought zone, while below 30 signifies the oversold zone. Also, you can use 60 and 40 levels if you are doing intraday trading, as this indicator gives insight into price momentum. It’s one of the best indicators on tradingview and very popular among traders.

If you’re interested in learning more about RSI, check out my post, “The Secret Guide To RSI Indicator-Explained,” which goes into more detail.
4. VWAP Indicator
Volume-weighted average price (VWAP) is an important tool traders use to check the average price of a stock, crypto, currency, etc. over a specific time. It’s a beneficial tool for traders because it considers the price and volume of a stock, crypto, currency, etc., giving more accurate information about the stock’s actual value. It’s beneficial in volatile markets because it helps identify potential entry and exit points.
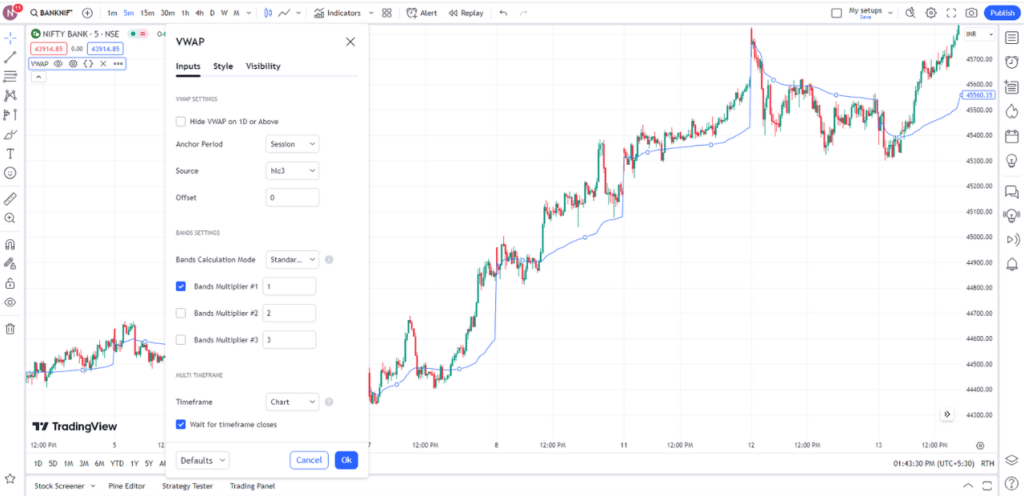
Additionally, VWAP (Volume Weighted Average Price) works as dynamic support and resistance for the price. Many traders rely on this indicator to identify trends: when the price is above VWAP, it suggests an uptrend, whereas when it falls below VWAP, it indicates a downtrend. That is why it’s the best indicator of tradingview, which traders use openly in day trading.
5. Supertrend Indicator
As the name suggests, the Supertrend indicator is a trend-following indicator. Supertrend indicator use average true range and factor multiplier to provide buying or selling signals.
The effectiveness of the Supertrend indicator can vary based on the timeframe and the ATR period chosen. Shorter timeframes may generate more frequent signals but can also reduce noise on a chart, while longer timeframes may provide more reliable signals but less frequently.

Traders also use the Supertrend as a tool for setting stop-loss orders. When in a long position, they may place their stop-loss just below the Supertrend line and in a short position just above it. This strategy helps protect against adverse price movements.
A Supertrend indicator is a valuable tool for trend-following traders, helping them identify potential trend reversals and manage their positions more effectively.
6. ADX Indicator
The ADX Indicator is used to show the strength of a trend. It is based on the Directional Movement Index (DMI), which consists of the Positive Directional Indicator (+DI) and the Negative Directional Indicator (-DI).
The ADX Indicator measures the trend’s strength by calculating the difference between the +DI and -DI lines and smoothing the result over a certain period.

A high ADX shows a strong trend, while a low ADX shows a weak or sideways market trend. Traders can use the ADX Indicator to confirm a trend strength. It is important to note that the ADX Indicator does not indicate the direction of the trend, only the strength of it.
Traders can use this information to decide whether to enter or exit from the trade based on strengths or weaknesses, which is why this is the best indicator on Tradingview to make good entry and exit decisions.
7. Auto Fib Retracement Indicator
Auto Fib Retracement indicator is very useful for those who like to use Fib Retracements to find important support and resistance levels. This indicator automatically adds Fib Retracement levels on a chart, quickly showing good support and resistance levels.

Traders can save time and view retracement levels on multiple time frames using the Auto Fib tool instead of manually drawing their own Fib Retracement lines. You can also change the Fib values per your setup or needs.
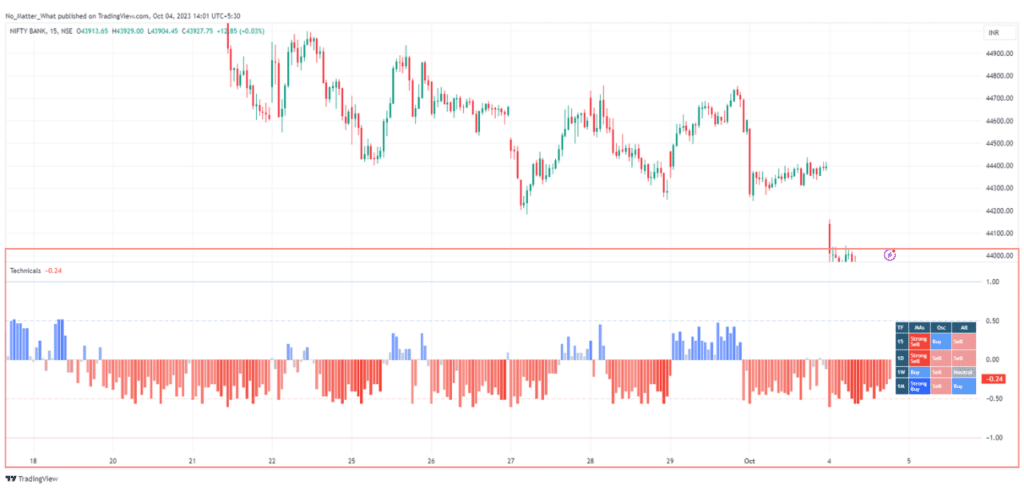
8. Technical Rating Indicator
The Technical Rating Indicator on Tradingview is a helpful tool for traders. It signals when it might be a good time to buy or sell a stock or anything else.
Here’s how it works:
- Different Signals: It checks 11 other indicators that help us understand how the price is doing. These include trends, how fast the price changes, and more.
- Buy and Sell Signals: It shows blue bars when it’s a good time to buy and red bars when it thinks it’s a good time to sell.
- Visual Representation: You can see these signals as bars underneath the price chart. This makes it easy to know if it’s a good time to make a move.
- Adjustable Settings: You can change the settings to make it more or less sensitive, depending on how quickly you want to react to changes.
- Extra Info: A table also tells you more details about what’s going on. It lets you know if it’s a good time to buy or sell in the short, medium, or long term.
In simple terms, it’s like having a traffic light for trading. When it’s green (blue bars), it’s a good time to go (buy). When it’s red (red bars), it’s a good time to stop (sell). You can adjust how sensitive it is, and it gives you more details to help you make smart decisions when trading.
9. Ichimoku Cloud Indicator
The Ichimoku Cloud is like a weather forecast for traders. It helps to see the overall trend and potential support and resistance levels for stock or any asset. Here’s how it works:
- Cloud Formation: The Ichimoku Cloud is made up of two lines, Senkou Span A and Senkou Span B. When Span A is above Span B, it forms a cloud. This cloud is usually green when it’s bullish (good for buying) and red when it’s bearish (time to be cautious).
- Trend Direction: If the price is above the cloud, it suggests an upward trend (good for buyers). If it’s below the cloud, it indicates a downward trend (better for sellers).
- Support and Resistance: The cloud also acts as a support (when the price is above it) or resistance (when below it). It helps you figure out where prices bounce up or down.
- Lagging Line: A lagging line shows the current price but shifts back in time. This can be used to confirm trends.

So, think of the Ichimoku Cloud as a tool that helps to know if it’s sunny (good for buying), cloudy (be cautious), or rainy (better for selling) in the market. It helps understand trends and decide when to enter or exit trades. But like any tool, it works best with other information and strategies.
10. MACD
Moving average convergence divergence (MACD) is a technical analysis’s most popular tool or momentum indicator. It’s like a signal light for traders, telling them when it might be a good time to buy or sell something. Here’s how it works:
- Two Lines: MACD has two lines on the chart. One is called the MACD line, and the other is the Signal line.
- Crossover: When the MACD line crosses above the Signal line, it’s like a green light to buy because it suggests the price might increase.
- Divergence: If the MACD line moves away from the Signal line, it’s a sign of strong momentum in the direction it’s going. This can help confirm a trend.
- Histogram: A histogram also shows the distance between the MACD and Signal lines. It’s bullish (good for buying) when it’s above the zero line, and when it’s below, it’s bearish (better for selling).

So, MACD is like a traffic light. When it turns green (MACD crosses above Signal), it’s a good time to go (buy). When it turns red (MACD crosses below Signal), it’s a good time to stop (sell). It helps traders spot potential trend changes and momentum shifts.
Final Words
As I mentioned, a wide range of indicators are available on Tradingview, but these ten are the best. You can take RSI, Supertrend, Moving Average, or Auto Fib Retracement. There is an indicator for any trading style you want.
In this blog post, I discussed the top 10 best tradingview indicators and how they can help you trade more wisely. Remember, these indicators aren’t magic tools. They require time and practice to work successfully in your day trading. Additionally, it’s crucial to know that indicators are just one part of the trading tools; we should combine them with other essential tools to make informed trading decisions.
FAQ
What indicator do most traders use?
There are multiple indicators on Tradingview, and traders can choose a better indicator that suits their trading style. However, some popular indicators among traders are Moving Averages, RSI, MACD, etc.
What are TradingView indicators?
Tradingview Indicators are tools that help you make decisions. They use past price data to tell you where the price might go next.
Are the best Tradingview indicators free?
Are the best Tradingview indicators free?
How to find the best Tradingview indicator for my trading strategy?
To find the best TradingView indicators for your trading strategy:
- Understand your strategy and goals.
- Research and test indicators.
- Combine and evaluate them.
- Keep it simple and flexible.
- Learn from experts.
- Backtest and analyze results.
- Use paper trading for practice.
Can I create custom indicators on TradingView?
Yes, you can create custom indicators on TradingView. TradingView offers a built-in Pine Script language that allows you to code and customize your indicators, strategies, and alerts to suit your specific trading needs. This feature allows you to design and use unique technical analysis tools tailored to your trading strategy.
Yes, you can create custom indicators on TradingView. TradingView offers a built-in Pine Script language that allows you to code and customize your indicators, strategies, and alerts to suit your specific trading needs. This feature allows you to design and use unique technical analysis tools tailored to your trading strategy.


Hi Akash,
Can you share the above in PDF? Please